
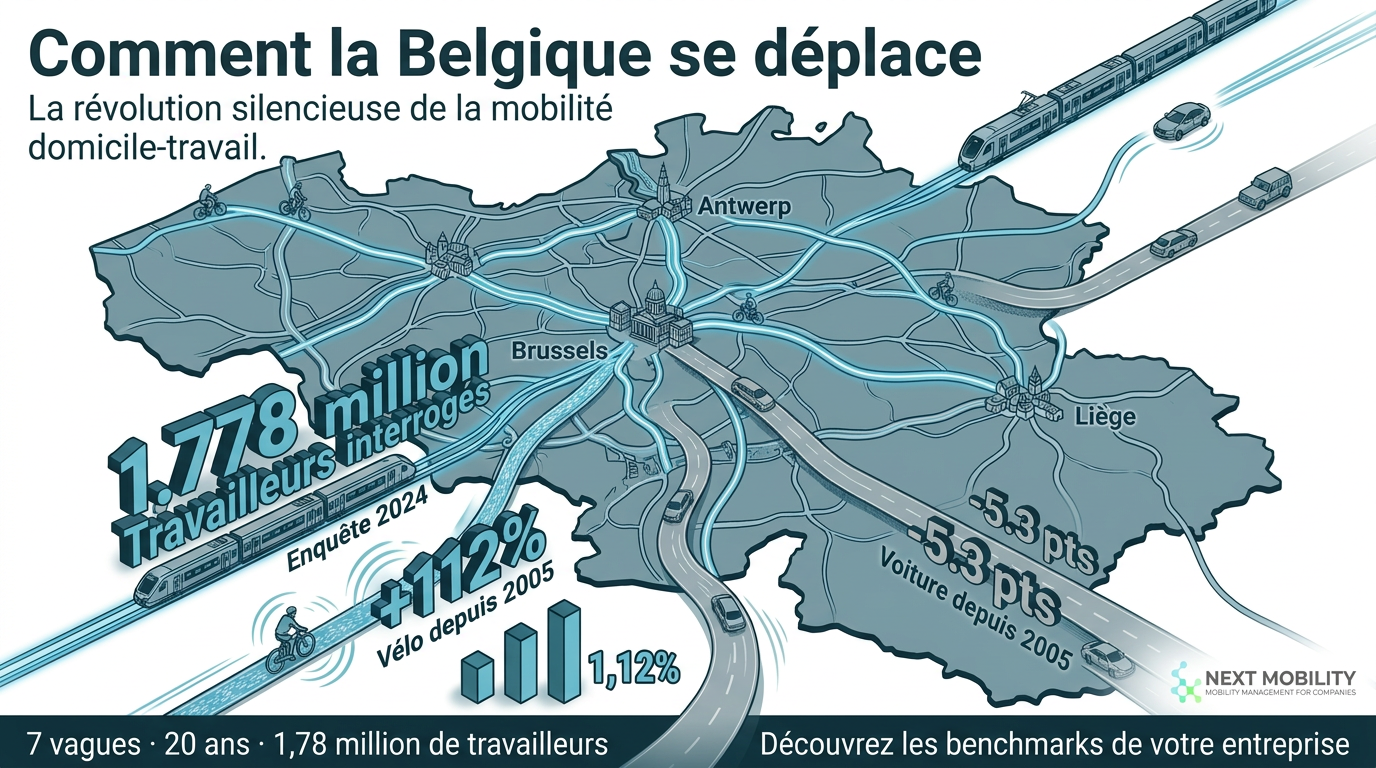
Since 2005, Belgium has been systematically measuring how its workers travel to and from work. Seven survey waves. 1.78 million workers surveyed in 2024. Data collected by the FPS Mobility and Public Works as part of the federal home-to-work travel diagnosis (Woon-Werkverkeer, or WWV).
This data exists. It is publicly available. But it remains difficult to access: raw tables, thick PDF reports, a level of detail by municipality and sector that few companies have the time to process.
That is exactly why Next Mobility built this page.
What 20 years of data reveal
The major trends are clear. The car remains dominant at 61.4% of commutes in 2024, but has lost 5.3 percentage points since 2005. Cycling has doubled: from 7.8% to 16.5%, representing +112% over twenty years. Rail remains stable at around 10%. This transformation happened without any dramatic disruption — municipality by municipality, measure by measure.
But national averages say little about your specific situation. That is where the tool makes the difference.
What you will find in the interactive analysis
The analysis covers five dimensions.
National and regional modal split, with evolution since 2005, broken down by commute distance. Distance remains the #1 factor in transport mode choice: below 5 km, cycling is competitive; between 10 and 30 km, rail takes over; beyond that, the car dominates — unless employer measures shift the equation.
The measured impact of employer measures on modal choice, based on 10,161 company sites. The figures are unambiguous: a cycling allowance increases the cycling modal share by +15.4 percentage points at companies that apply it. Full public transport reimbursement: +11 points. These are not estimates — they are observed data.
The CO₂ footprint of commutes by workplace, with a transparent methodology and a map at municipality level.
A sector analysis by NACE code: remote work, cycling, rail — every sector has its profile, its history, its own levers.
And an interactive benchmarking tool: enter your company’s postcode to see your municipality’s modal split in 2024, benchmarked against your sector and the national average.
Why this matters for your company
An effective commuting plan starts with real data, not generalities. This analysis allows you to place your company in its geographical and sectoral context, identify the most relevant levers based on your employees’ profile, and build an evidence-based case for your HR, facility, or ESG decisions.
This is not a report to read once and file away. It is a diagnostic tool to use right now.
→ Explore the interactive home-to-work travel analysis
Want to go further?
Next Mobility delivers tailored analyses for your company: mobility diagnosis, commuting plan, COBRACE guidance, mobility budget implementation. Every analysis starts from your real data — site locations, employee profile, sector of activity — and leads to concrete, actionable recommendations.
Data: FPS Mobility and Public Works, federal home-to-work travel survey 2024. Visualisation: Next Mobility.
We would like to thank Christophe Pauwels (FPS Mobility and Public Works) for sharing the raw data and for his careful review of this page.