
92.6% of workers with a mobility budget do not have a company car. This figure alone should change how businesses approach the topic. Here is the complete analysis of the latest ONSS (RSZ) monitoring report, with what it means concretely for your mobility policy.
The Source
In March 2026, ONSS published the latest edition of its Monitoring Report on the Greening of Company Car Fleet. This quarterly report, produced since 2022, combines two databases: employers’ social declarations (DmfA) and the vehicle registration register (DIV). It covers company cars for employed workers — not self-employed individuals or self-employed company directors.
This is not a survey. These are not estimates. These are real administrative data from all Belgian employers who declare company cars or mobility budgets.
The report covers quarters 2022/1 to 2025/4 for fleet data, and calendar years 2022 to 2024 for mobility budget data (2025 figures will be available in the annual report for calendar year 2025).
Belgium’s Company Car Fleet: Current State
Before discussing the mobility budget, here’s an overview of the total fleet.
In the fourth quarter of 2025, Belgium has 573,905 company cars declared by 59,170 employers, for 572,897 workers concerned. The fleet is slightly up from 2022 (516,198 cars in Q1 2022), driven primarily by electrification.
On electrification: 37.19% of the fleet is now 100% electric (BEV). And more importantly, 80.39% of new company cars ordered are electric. The transition is underway, and it’s rapid.
Average CO₂ per vehicle is declining as a result. The CO₂ solidarity contribution remains high (coefficient 4.00 since January 2026, rising to 5.50 in January 2027), making thermal vehicles increasingly expensive for employers.
Mobility Budget: Exponential Growth
This is the most striking part of the report. In three years, the mobility budget has gone from a niche tool to a measurable phenomenon.
Global Figures
| Year | Workers | Employers | Total Budget | Average Budget/Worker |
|---|---|---|---|---|
| 2022 | 5,186 | 745 | €31.1M | €5,999 |
| 2023 | 10,250 | 1,155 | €72.0M | €7,023 |
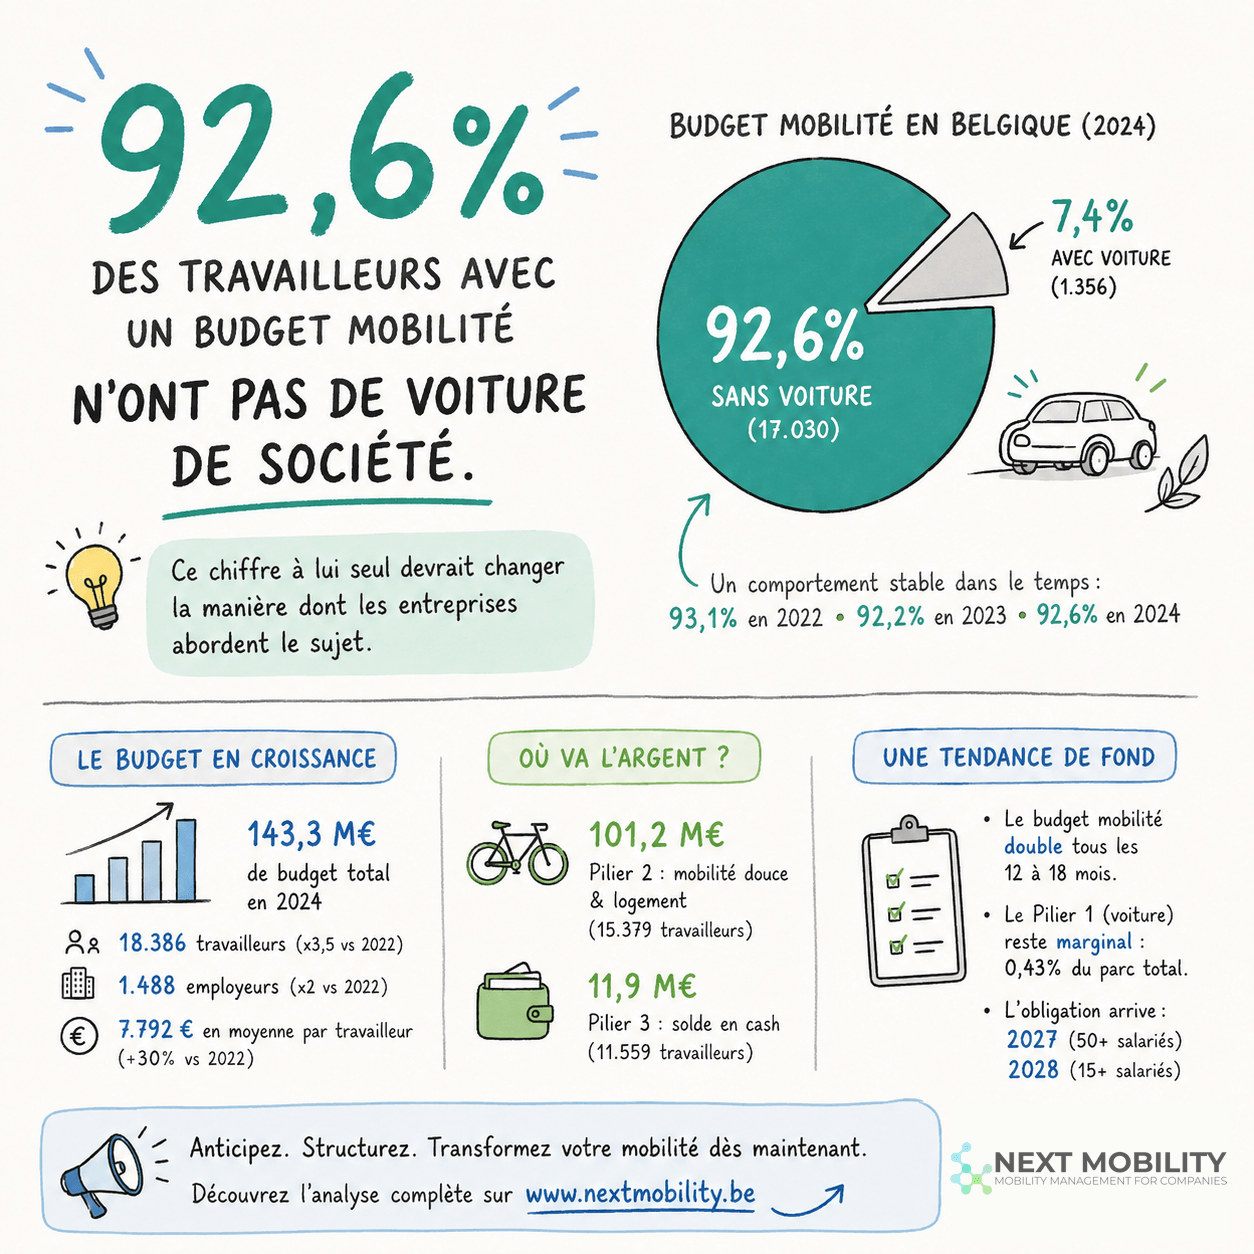
| 2024 | 18,386 | 1,488 | €143.3M | €7,792 |
In two years, the number of workers increased 3.5 times. The total amount increased 4.6 times. And this is before the legal obligation scheduled for January 2027 (companies with 50+ workers) and January 2028 (companies with 15+ workers).
The average budget per worker is also increasing: from €5,999 in 2022 to €7,792 in 2024 (+30%). This likely reflects the arrival of higher-budget profiles (managers, roles with higher-category vehicles) in the system.
In Relation to Total Fleet
To put this in perspective: 18,386 workers with a mobility budget represents 3.2% of the 572,897 workers with company cars. It’s still a minority. But the trend is clear: the system doubles every 12 to 18 months. If the trend continues — and the 2027 obligation will accelerate it — the 50,000 worker threshold could be reached as early as 2026.
The Figure Nobody Cites: 92.6% Without a Car
This is the most striking result from the report, and the one that should concern every fleet manager and HR director in Belgium.
Of the 18,386 workers with a mobility budget in 2024, 17,030 do not have a company car in Pillar 1. That is 92.6%.
This percentage is remarkably stable over time: 93.1% in 2022, 92.2% in 2023, 92.6% in 2024. This is not a startup effect. This is structural behavior.
Pillar 1 of the mobility budget requires an “environmentally-friendly vehicle” (100% electric or emissions ≤ 50 g CO₂/km). But even with this option available, the vast majority of workers choose not to take a car and allocate their budget to Pillars 2 and 3.
Why? The most likely explanation is mathematical. If your mobility budget is €700/month and an electric car in Pillar 1 costs €500-600/month in TCO, only €100-200 remains for the other pillars. At €0 car cost, the entire budget becomes available for soft mobility, housing, or cash.
Where the Money Goes: Pillar 2 and Pillar 3
Pillar 2: Soft Mobility and Housing — €101 Million
Pillar 2 covers sustainable mobility expenses (public transport subscriptions, bicycles, scooters, carpooling) and housing costs (rent or mortgage interest for housing within 10 km of the workplace).
| Year | Total Pillar 2 Amount | Workers with Pillar 2 | Average Amount |
|---|---|---|---|
| 2022 | €19.6M | 4,077 | €4,798 |
| 2023 | €50.8M | 8,329 | €6,101 |
| 2024 | €101.2M | 15,379 | €6,579 |
Important methodological note: ONSS Pillar 2 data covers only workers without Pillar 1 (without a car). Workers who keep a car in Pillar 1 can also use Pillar 2 for the balance, but this amount is not isolatable in DmfA declarations. The €101 million is therefore an underestimate of the actual amount spent on soft mobility.
The average amount of €6,579/year per worker (approximately €548/month) is significant. This is the price of a combined SNCB + STIB subscription plus an electric bike lease, with room to spare. Or substantial rent relief for a worker who moves closer to the workplace.
We also know that the “housing costs” item represents a large share of Pillar 2. The viral post of April 2, 2026 about 77% of the mobility budget going to housing shed light on this subject — and it’s one of the regulatory debates currently underway (cap at €200/month?).
Pillar 3: Cash Balance
| Year | Workers with Pillar 3 | Share of Beneficiaries | Average Amount | Total Special Contribution |
|---|---|---|---|---|
| 2022 | 3,535 | 68.2% | €2,717 | €3.6M |
| 2023 | 6,551 | 63.9% | €2,372 | €5.9M |
| 2024 | 11,559 | 62.9% | €2,712 | €11.9M |
Approximately two-thirds of workers with a mobility budget receive a cash balance via Pillar 3. This balance is subject to a special contribution of 38.07% charged to the worker, making it less advantageous than a benefit in kind, but it remains net of tax.
The average amount (€2,712/year) and declining share (from 68% to 63%) suggest that workers are progressively allocating more to Pillar 2 and less to cash. The system is maturing: beneficiaries are learning to optimize their budget.
The Pillar 1 Fleet: A Micro-Fleet with Rapid Growth
For the 7.4% of workers who keep a car in Pillar 1, quarterly data shows steady progression:
| Quarter | Pillar 1 Cars | Share of Total Fleet | Workers with Pillar 1 | Employers with Pillar 1 |
|---|---|---|---|---|
| Q1 2022 | 213 | 0.04% | 260 | 59 |
| Q4 2022 | 399 | 0.07% | 419 | 82 |
| Q4 2023 | 947 | 0.17% | 1,121 | 141 |
| Q4 2024 | 1,835 | 0.32% | 2,031 | 223 |
| Q4 2025 | 2,459 | 0.43% | 2,655 | 297 |
From 213 cars in Q1 2022 to 2,459 in Q4 2025: growth is real, but Pillar 1 remains marginal. The mobility budget is structurally an alternative mobility tool, not a fleet renewal tool.
What This Data Changes for Your Company
If You’re a Fleet Manager
The mobility budget will not reduce your fleet. It will transform it. The 92.6% of workers without a Pillar 1 car are vehicles leaving your fleet and not coming back. Your challenge: anticipate the impact on your leasing volumes, supplier negotiations, and operational management of a fleet that will mechanically shrink with the 2027 obligation.
If You’re an HR Director
The mobility budget is a tool for attractiveness and retention. 18,386 workers are already using it. When the obligation takes effect, candidates will compare mobility policies. Having a structured policy before the deadline is a competitive advantage. Building it in a rush in December 2026 is an operational risk.
If You’re a CFO
The tax figures deserve attention. The average budget is €7,792/year per worker. The special contribution on Pillar 3 already represents €11.9M nationally. And the CO₂ solidarity contribution coefficient is rising from 4.00 to 5.50 in January 2027, making every remaining thermal car in your fleet more expensive. The TCO calculation of car vs. mobility budget is shifting — if it hasn’t already.
Three Concrete Actions
- Do the calculation for your company. How many workers have company cars? What’s the average TCO? What would that represent as a mobility budget? This diagnosis takes 2 hours and gives you a quantified decision-making foundation.
- Structure your Pillar 2 seriously. €101 million in Pillar 2 shows this is the heart of the system. Your policy should cover transport subscriptions (SNCB, STIB, De Lijn, TEC), bicycles (purchase, lease, maintenance), and housing costs — with clear rules.
- Don’t wait for the obligation. Companies implementing today benefit from a year of learning before the system becomes mandatory. Those waiting until January 2027 will have to do everything in a rush — with a saturated provider market.
In Summary
Belgium’s mobility budget is no longer a gimmick. €143 million, 18,386 workers, growth doubling every 18 months. And the strongest signal: 9 out of 10 workers choose not to keep a car. The system works, it is measured, and it will become mandatory. The question is no longer “should we do this” but “are you ready”.
Source: ONSS, Monitoring Report on the Greening of Company Car Fleet (Employed Workers), March 2026. Indicators for quarters 2022/1 to 2025/4. Mobility budget data by calendar year (2022-2024). Full report available on the ONSS website.
Don’t know where to start? Next Mobility supports Belgian companies in implementing their mobility budget — from fleet diagnosis to operational policy.
Book a meeting: calendly.com/nicolas-nextmobility
nicolas@nextmobility.be