
Belgian companies are moving too slowly when it comes to sustainable mobility. A newly published Mobility Index from Securex reveals that most firms are far from meeting regional climate and mobility goals. Below, I unpack the results, the methodology, and what companies can do (and should do) to catch up.
Key findings from the Securex Mobility Index
- The average score across Belgian companies is 3.73 out of 10, indicating a large gap with regional sustainability targets.
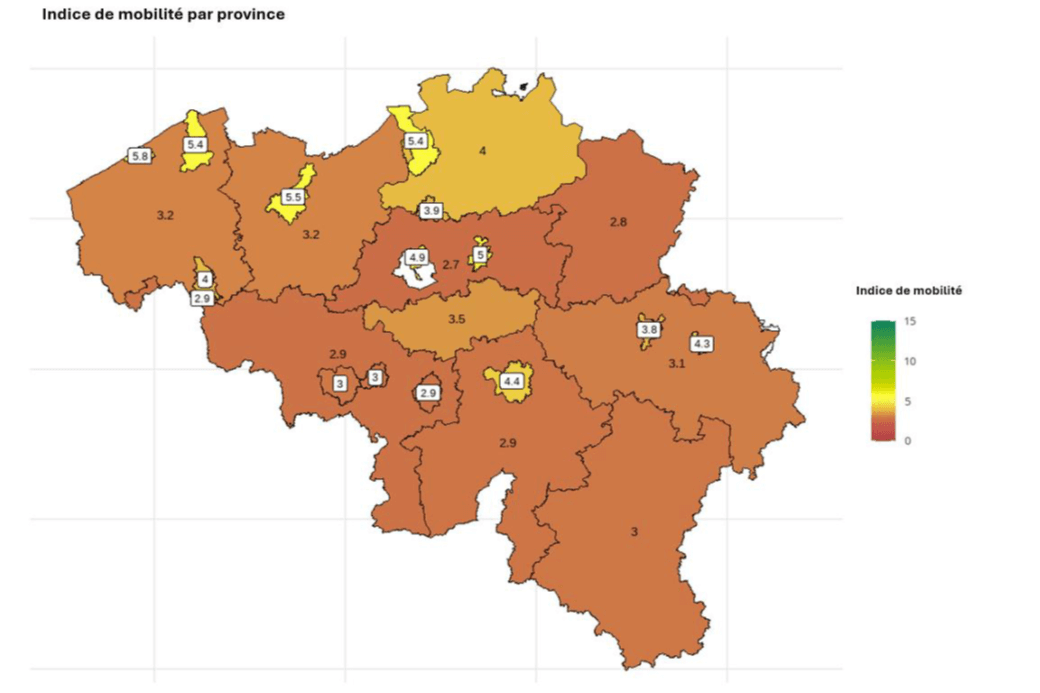
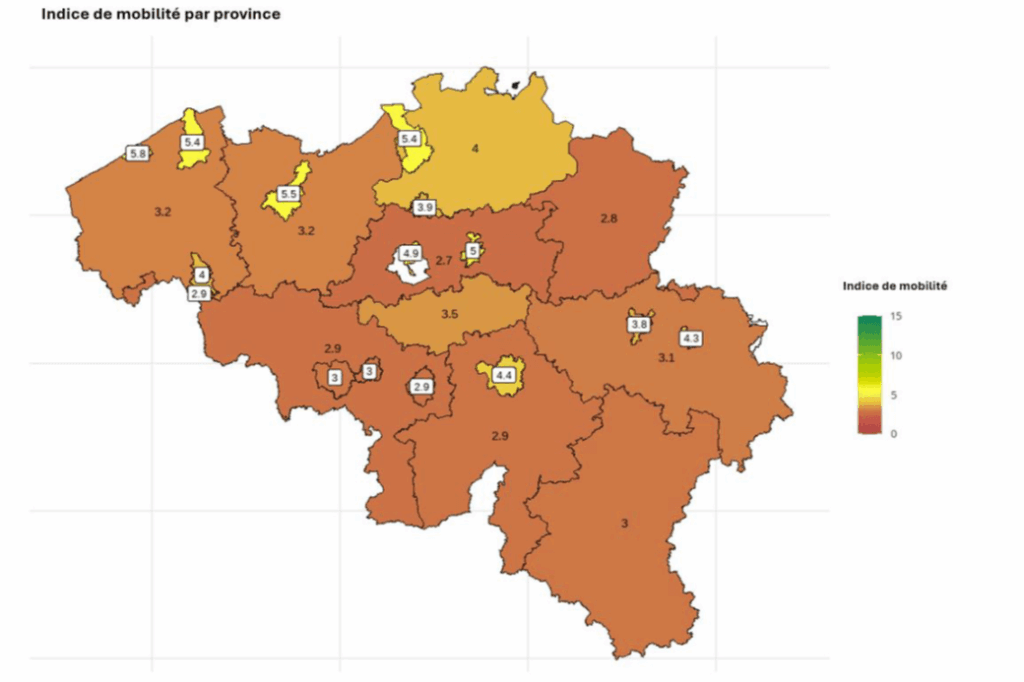
- Regional differences are stark:
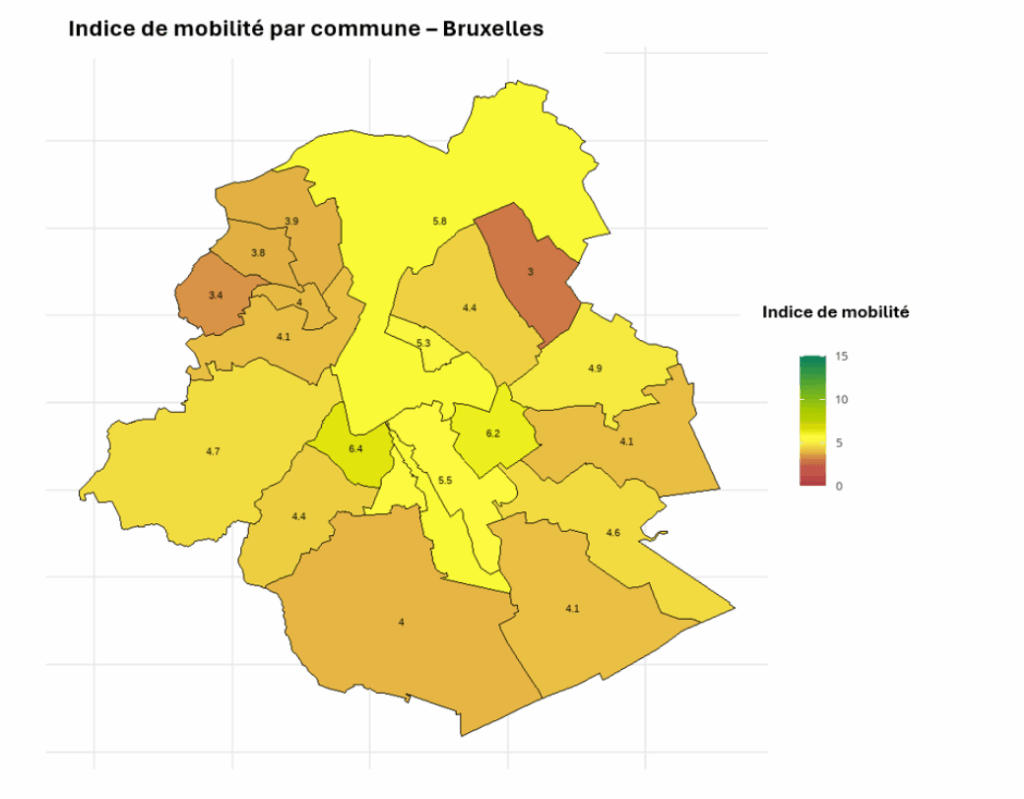
- Brussels achieves the highest average (5.05)
- Flanders is near the national average (3.70)
- Wallonia lags behind at 3.20
- More than ¾ of Belgian firms (≈ 76 %) score below 5, meaning they are significantly underperforming relative to ambitions.
- Only 1 in 8 companies reaches scores close to or above target levels.
- The index is based on data from 19,626 companies covering over 207,000 workers, making it quite representative.
How the index is built: 3 pillars, life-cycle emissions, and flexibility
The Securex Mobility Index is more than just a survey—it’s grounded in empirical data and a scientifically calibrated model. Here’s how it works:
- Three pillars of measurement:
- Electrification of fleets — share of company vehicles that are electric
- Modal shift — moving from individual car use toward public transport, cycling, walking, or shared mobility
- Reduction of trips — via remote work or other measures to lower commuting demand
- Life-cycle CO₂ accounting Emissions are not just from fuel use. The model includes emissions from manufacture, operation, and end-of-life for each mode of transport.
- Reference targets & flexible interpretation The index compares actual emissions against a “target” emissions level based on regional goals. If a company cannot use public transport because of location constraints, they can compensate with greater telework or bike use. In short: the index rewards context-sensitive pathways, not a one-size-fits-all regime.
Because of this flexible structure, shifts in one pillar (say, more remote work) can help mitigate weaker performance in another pillar (say, limited public transport access).
Barriers and systemic constraints
Why are so many companies underperforming? The index’s results and accompanying commentary highlight several structural obstacles:
- Cost hurdles: Electric vehicles remain more expensive despite fiscal incentives; SMEs in particular face budget constraints.
- Insufficient infrastructure: Outside urban centers, public transport is often sparse, and cycling infrastructure is fragmented or unsafe.
- Cultural inertia: The company car is still a prized benefit; many employers and employees are reluctant to shift modes.
- Regional disparities: Brussels benefits from high density, strong transit and cycling infrastructure, enabling firms there to perform better. Rural and suburban areas face more limited options.
These factors show that individual firms cannot succeed alone—progress requires coupling corporate action with supportive public policy, infrastructure investment, and regional coordination.
What firms can do immediately to raise their score
Here are tactical levers companies can activate quickly to improve their mobility performance:
- Electrify fleet vehicles (at least progressively)
- Promote alternative modes: incentives for public transport subscription, cash-for-bike schemes, bike leasing
- Structure regular remote working to reduce necessary commuting
- Engage employees in designing mobility plans (to ensure uptake)
- Map weak spots: Use the index’s diagnostic output to identify which pillar (fleet, modal shift, reduction) is dragging most
- Advocate for better infrastructure with municipalities and regional governments
Over time, improving one pillar can help unlock progress in others (e.g. more electric vehicles make shared mobility easier; more remote work reduces pressure on transit).