
🔍 End of May, SPF Mobility released key figures on mobility in Belgium.
Here’s what I found:
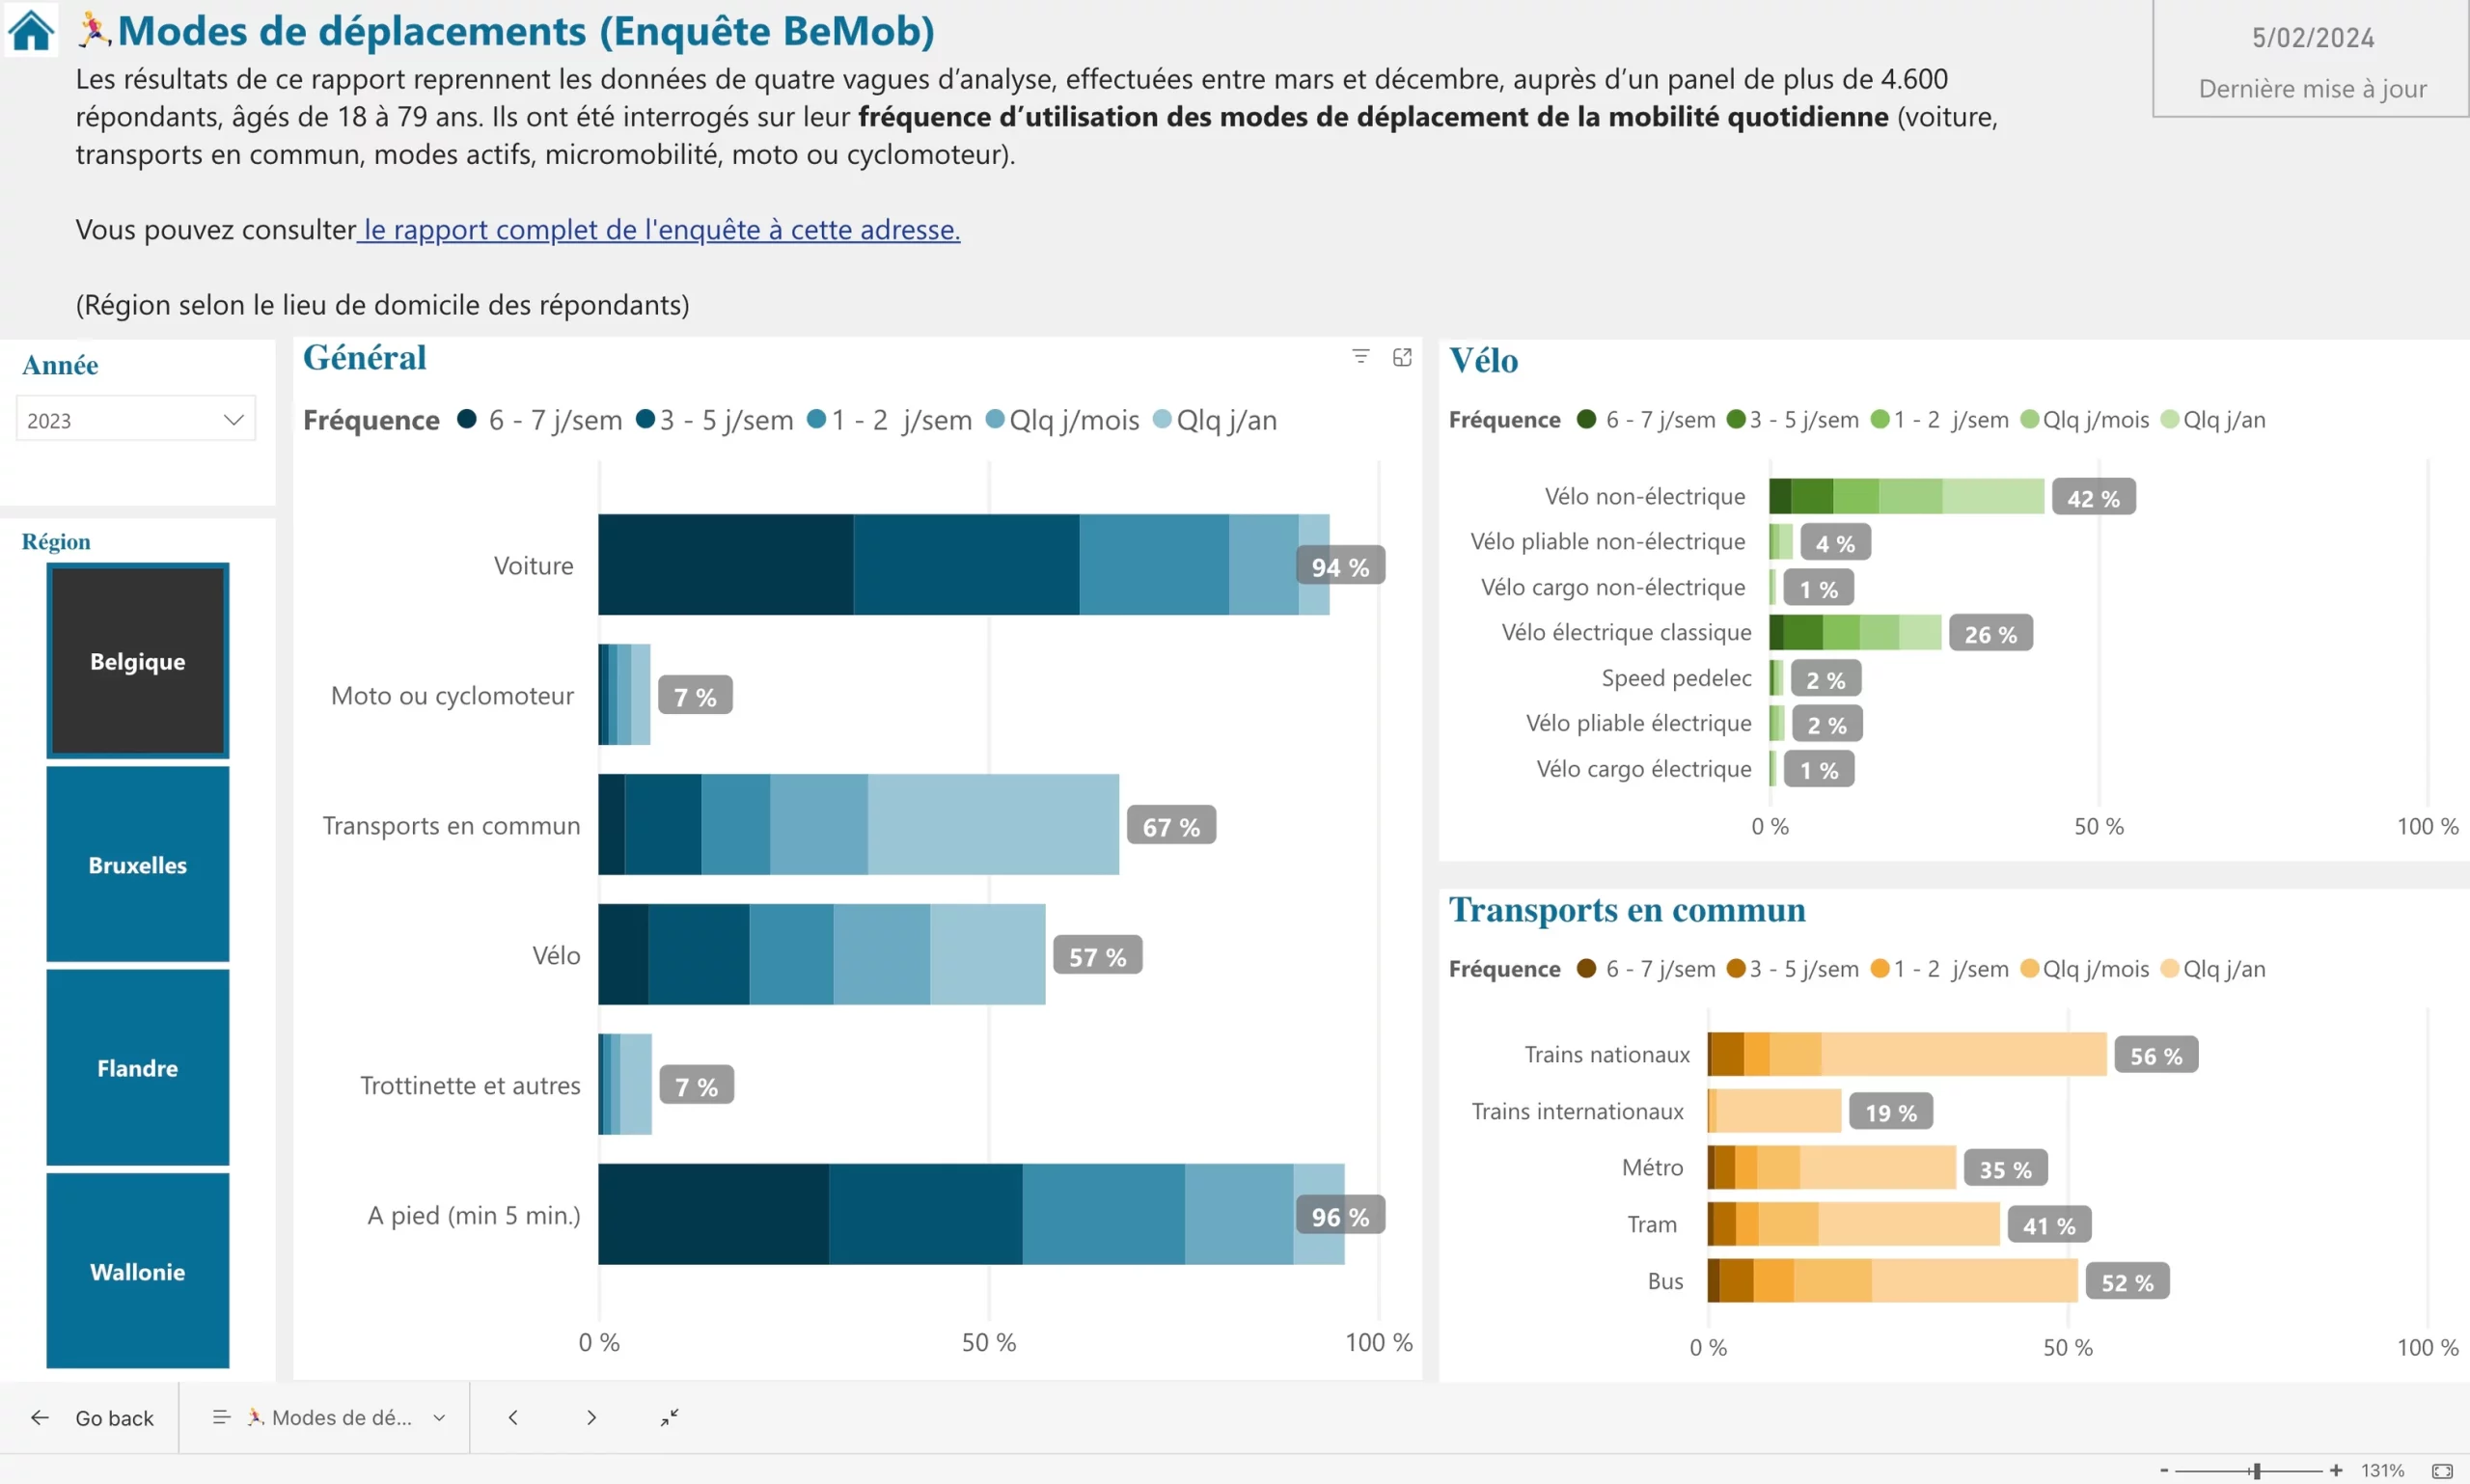
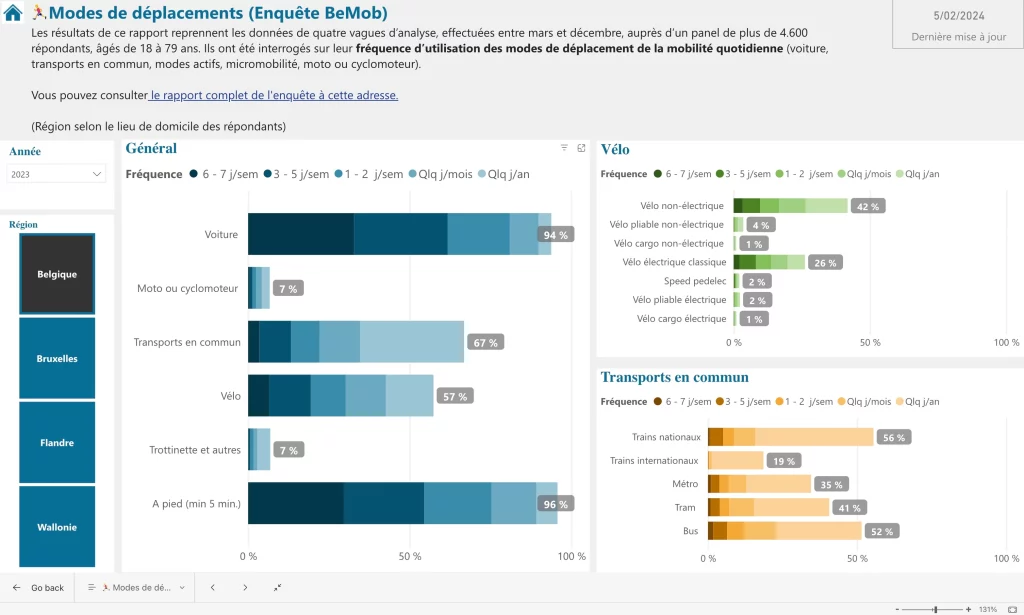
- 🚗 Car usage: Dominates with 94% of Belgians using cars.
- 🚇 Public transport: Utilized by 67% of the population.
- 🚴♂️ Bikes: Used by 57% of Belgians, with non-electric bikes still preferred (42% vs 26%).
- 🚅 Trains: Most used public transport, but daily public transport usage remains limited.
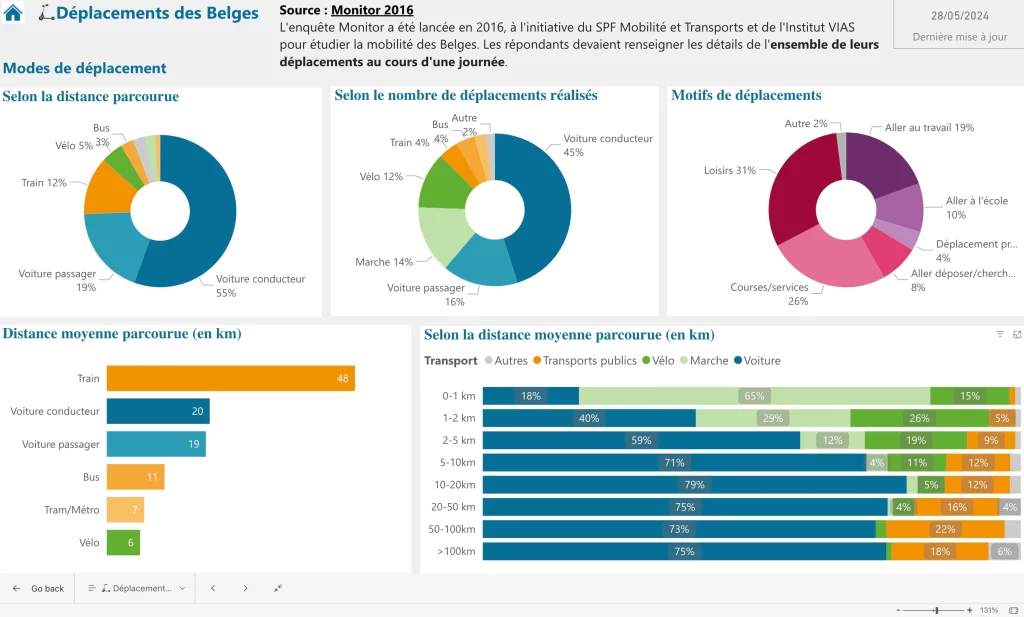
- 🚶 Short distances: Cars are the primary mode of transport for distances over 2 km.
- 🏞️ Journey purposes: 1/3 for leisure, 1/4 for groceries, and 1/5 for commutes.
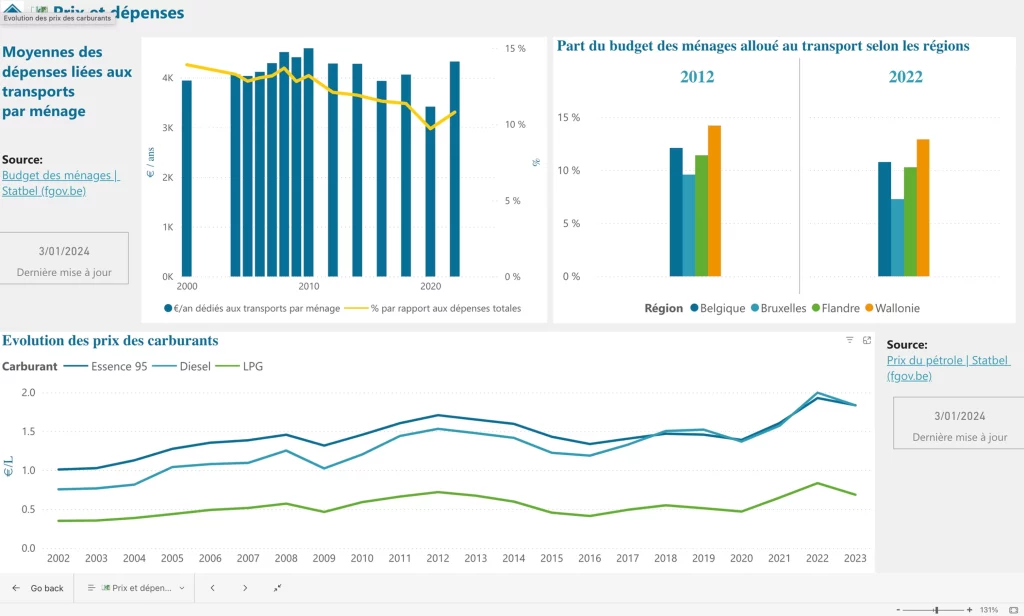
- 💸 Spending on mobility: Belgian families spend an average of €4328 annually on mobility.
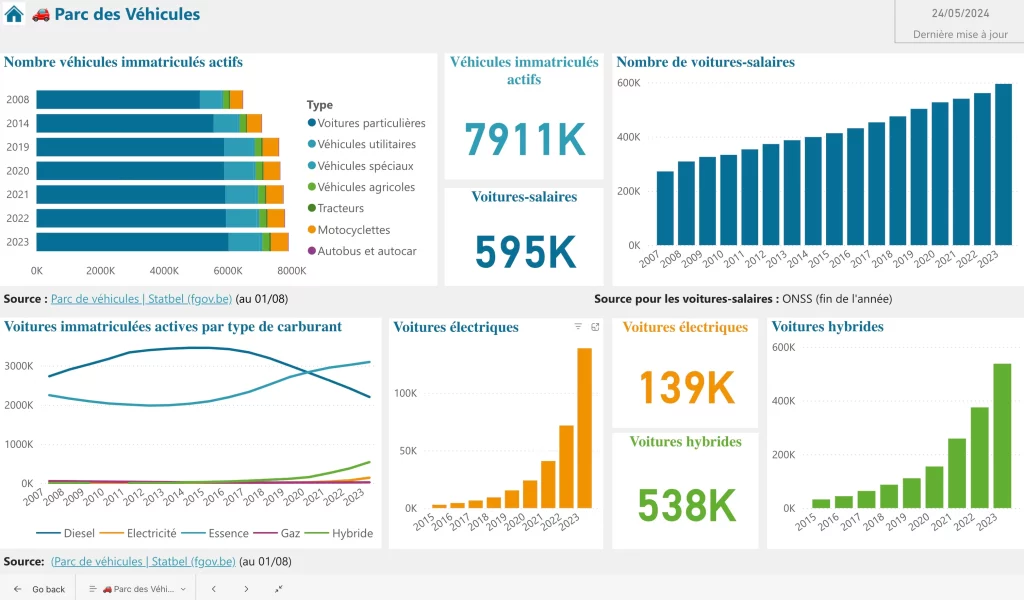
- 📈 Company cars: Increasing steadily, with around 600,000 in 2023. EV and PHEV usage is following a classic hockey stick growth pattern.
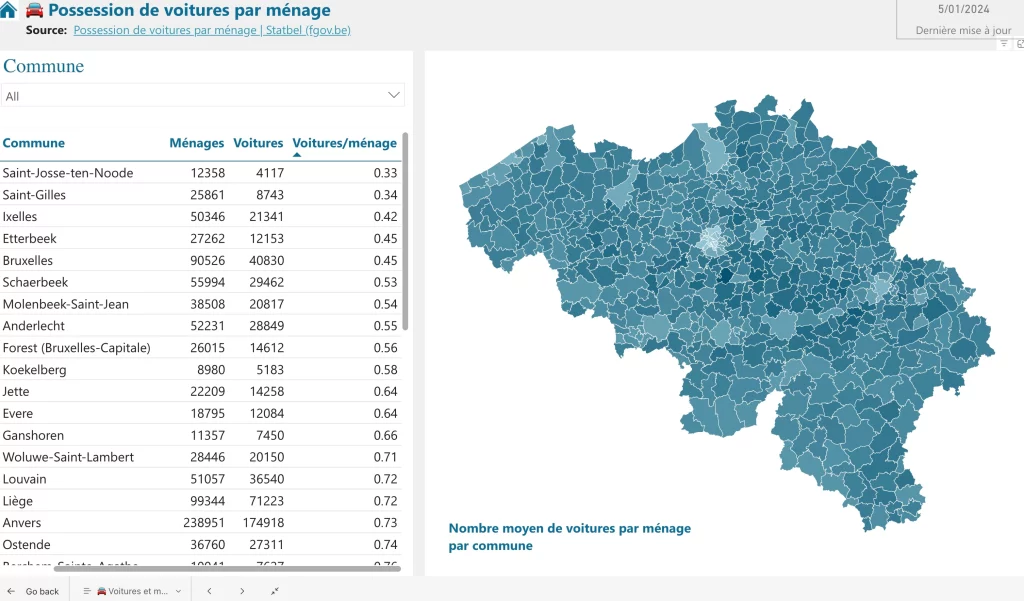
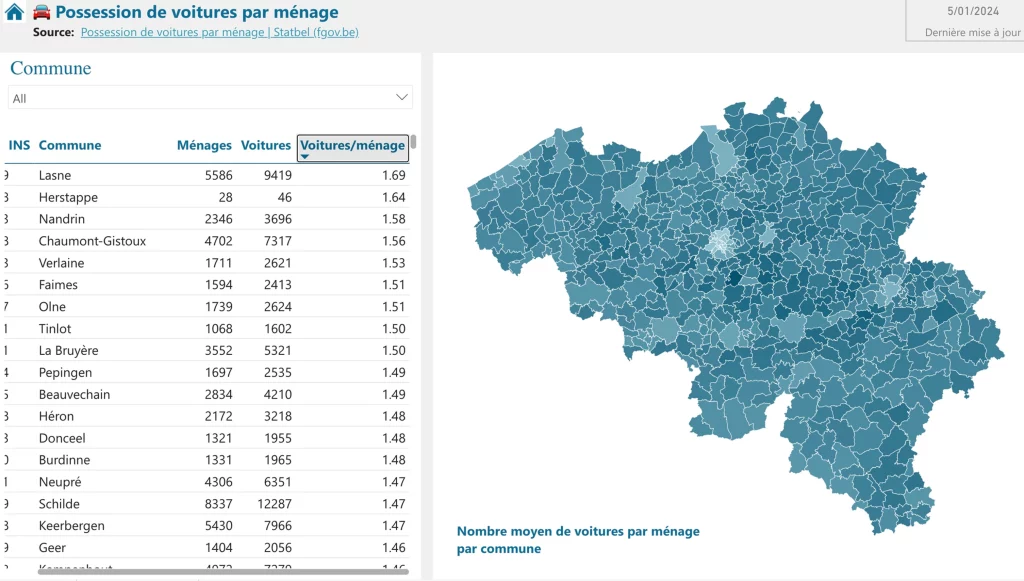
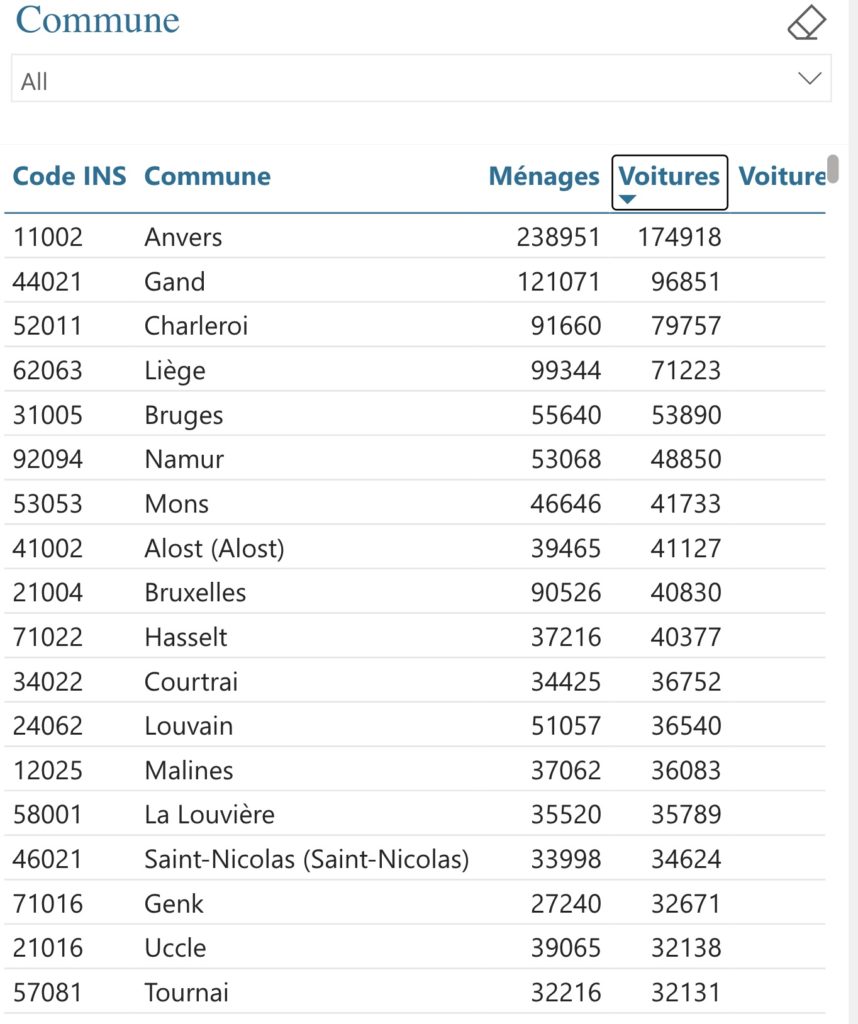
- 🌍 Commune statistics:
- Most cars per family: Lasne (1.69)
- Least cars per family: Saint-Josse (0.33)
- Most cars overall: Antwerp
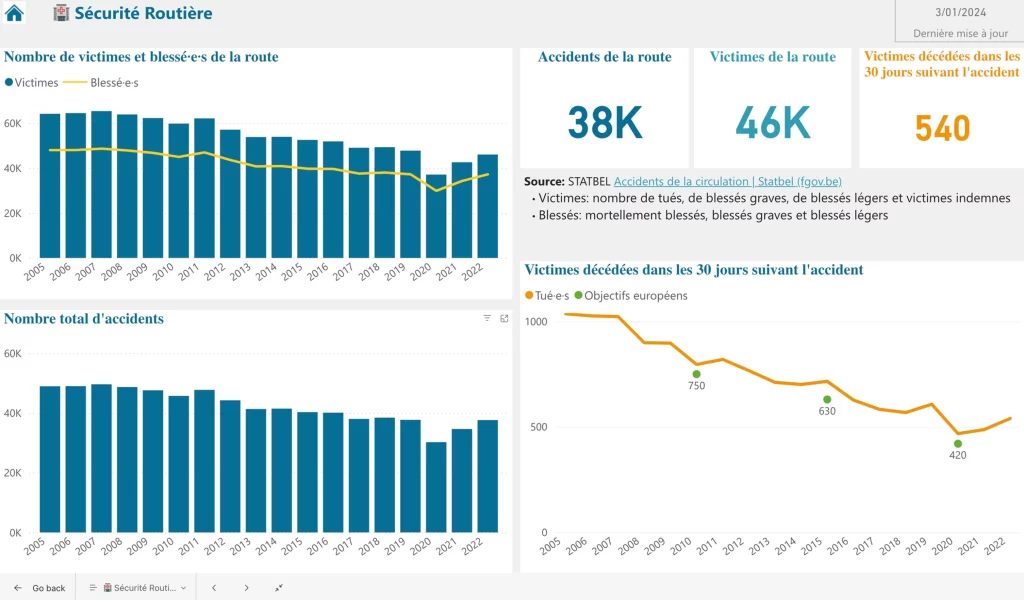
- 🛣️ Road safety: Increase in incidents over the past 3 years.
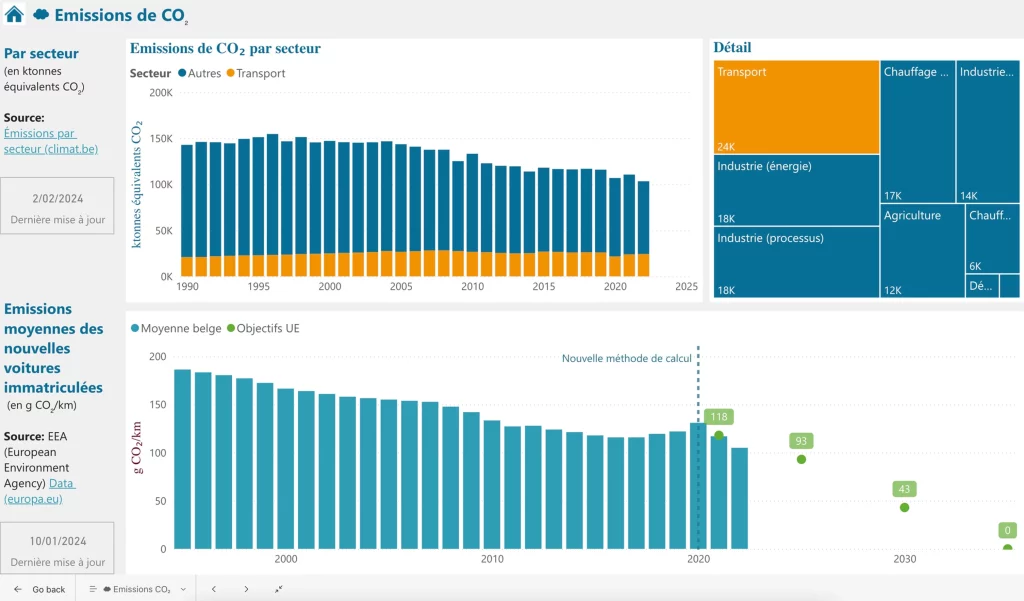
- 🌱 CO2 emissions: Decreasing per car, but total emissions from the sector remain stable.
🚀 Let’s work together for sustainable mobility in Belgium! 💚
#Mobility #SustainableTransport #Belgium #SPFMobility #EV #PublicTransport #RoadSafety #CO2Reduction #SustainableFuture