
January 20, 2026 | Reading time: 9 minutes
While the Brussels Motor Show is in full swing, BNP Paribas Fortis publishes a study that sheds light on ground reality: automotive electrification in Belgium is accelerating significantly.
For companies managing vehicle fleets, this data is essential. It reveals not only where electric car adoption stands in Belgium, but especially what concrete levers and obstacles exist for a successful transition.
We analyzed this study of 1,000 Belgians and extracted 7 actionable insights for fleet managers, HR managers, and mobility managers.
The context: why this study matters
Transport represents 25.1% of CO₂ emissions in Belgium. For companies covered by the CSRD directive, mobility-related emissions (scope 3) must now be reported.
Meanwhile, road congestion cost €5.65 billion in 2025, or 1.06% of Belgian GDP. An amount that directly weighs on business productivity.
In this context, fleet electrification becomes both an environmental and economic challenge.
Insight 1: electric adoption is really accelerating
The numbers
- 23% of Belgian households now own an electrified vehicle (full electric or hybrid)
- 9% own a 100% electric car (private or company)
- Progress: +7 points compared to 2024 (16% → 23%)
For businesses
This acceleration is significant. In one year, nearly 1 in 14 households has an electric vehicle. If this dynamic continues, we could reach 30% by end of 2027.
Concrete implication: The window of opportunity to renew fleets is narrowing. Companies that anticipate will benefit from:
- Better choice of available models
- Shorter delivery times
- Still favorable financing conditions
- A head start on regulatory obligations
Recommended action: Plan now a progressive replacement schedule 2026-2028, starting with vehicles most suitable for electrification (urban use, predictable mileage).
Insight 2: the electric second-hand market is taking off
The Numbers
- 18% of households are considering switching to electric by end 2027 (+7 points vs 2024)
- 28% of future electric buyers are interested in the second-hand market within 2 years
- 66% would prefer a professional seller, 25% a specialized certified site
For Businesses
The emergence of a mature electric second-hand market changes the game for professional fleets.
Opportunities:
1. TCO Reduction
- Purchase price -30 to 40% vs new
- Initial depreciation already absorbed
- Usage costs identical to new (electricity, maintenance)
2. Smart Fleet Mix
- New vehicles for intensive use
- Second-hand for occasional needs or testing
- Overall budget optimization
3. Real-Life Test
- Test electric at lower cost
- Validate real usage before generalization
- Gradually raise team awareness
Attention point: The preference for professional channels (66%) underlines the importance of guarantees. For fleet purchases, prioritize:
- Professional sellers with warranty
- Complete maintenance history
- Battery certification (health state >80%)
Recommended action: Integrate 10-20% electric second-hand in your next renewal wave to test the model on a small scale.
Insight 3: infrastructure is no longer a major obstacle
The numbers
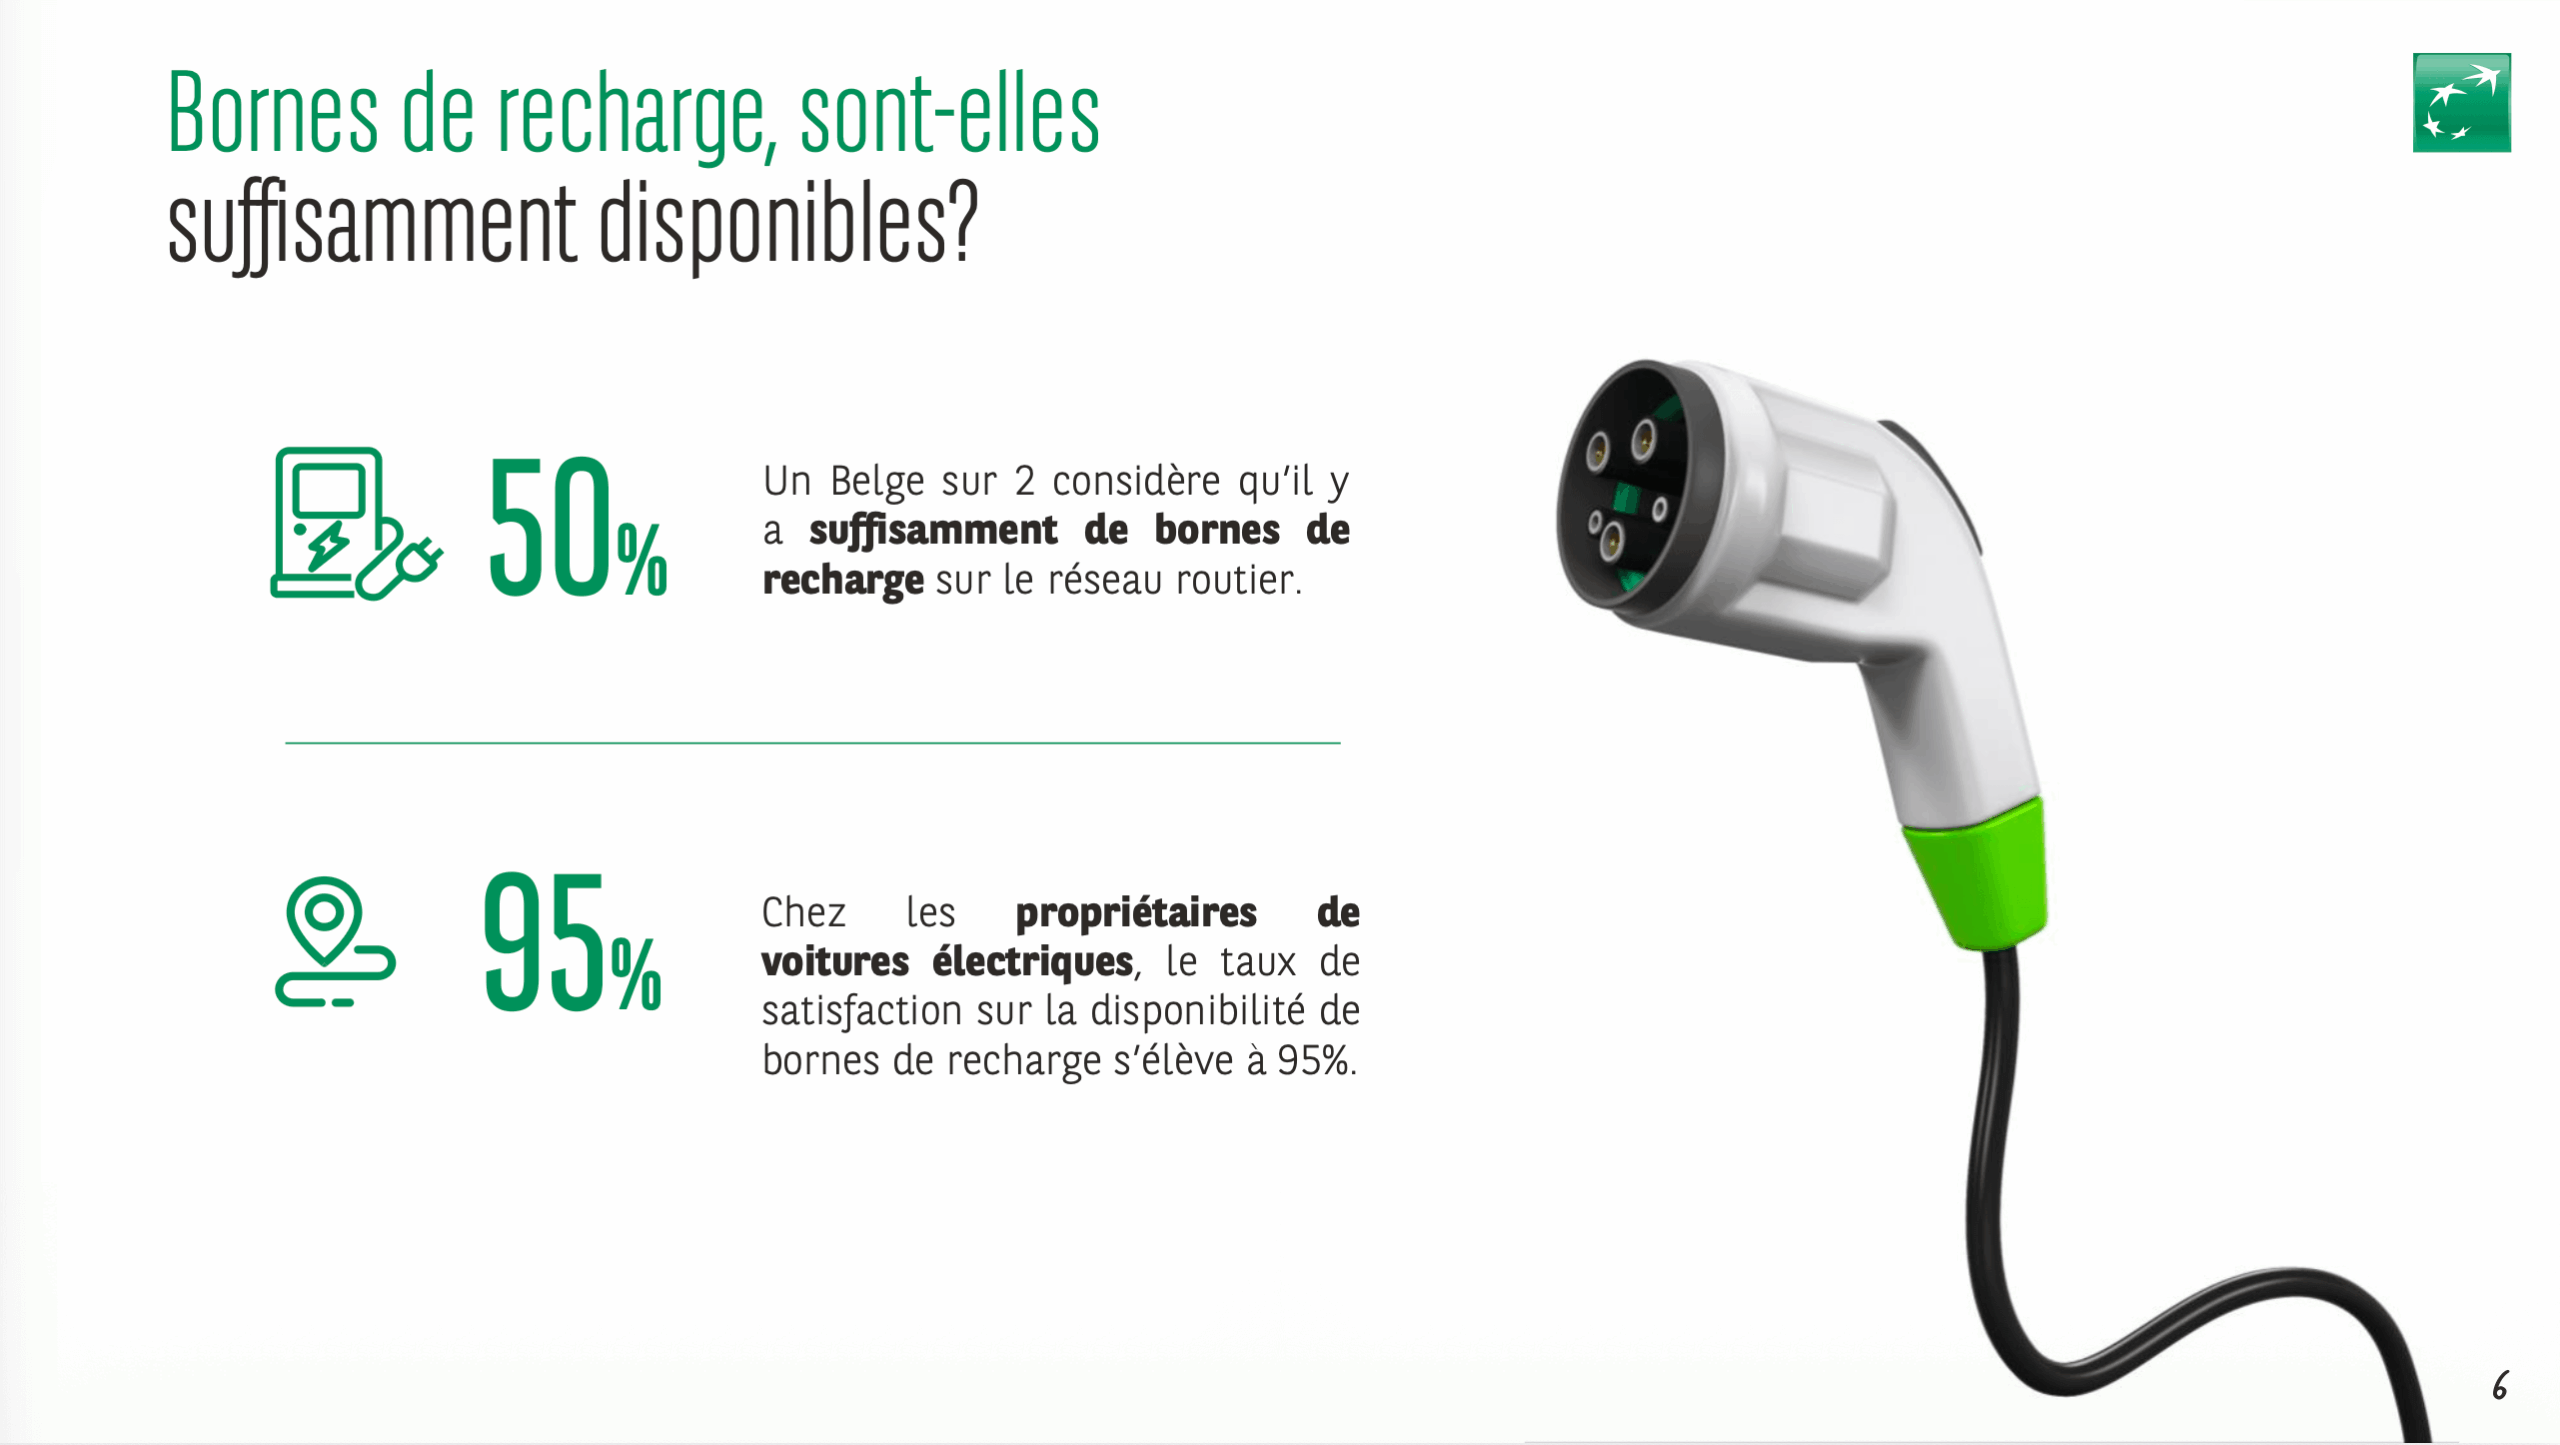
- 50% of Belgians believe there are enough charging points on the road network
- Spectacular evolution: In 2024, 43% found it difficult to find charging points, only 25% found them sufficient
- → Gain of +25 satisfaction points in 1 year
For businesses
This transformed perception is perhaps the most important insight from the study.
Range anxiety was the #1 barrier cited by employees. This barrier is massively falling.
Implications:
Strengthened Conviction Argument
- You can now use recent data
- “50% of Belgians find enough charging points”
- Counter objections with updated figures
Infrastructure Strategy
- The challenge shifts: from “how many charging points” to “where and how”
- Prioritize frequently visited sites (home, office)
- Optimize smart charging
Mobility Budget
- Employees without home charging are less penalized
- Broadens the profile of potential electric beneficiaries
- Facilitates inclusion in mobility budget
Recommended action: Update your internal communications with this 2026 data. Organize a Q&A session with electric owners in the company for real testimonials.
Insight 4: real experience far exceeds expectations
The numbers
- 95% satisfaction among electric vehicle owners regarding charging point availability
- Progress: +19 points vs 2024 (76% → 95%)
- Major gap: General perception (50%) vs real experience (95%)
For businesses
This 45-point gap between perception and reality is enormous.
Concrete translation: Someone who hesitates thinks “1 in 2 chance of finding a charging point”. Someone who drives electric knows that in reality it’s “95% satisfaction”.
The most powerful conviction lever: internal testimonials.
Winning Strategy:
Ambassador Program
- Identify your electric “early adopters”
- Organize internal testimonials
- Create a dedicated Slack/Teams channel for electric questions
Vehicle Tests
- Weekend loan for hesitant employees
- 1 week test with electric pool vehicle
- Charging cost reimbursement during test
Real Data
- Share real consumption and costs
- Short video testimonials (2-3 min)
- FAQ based on real questions
Recommended action: Launch a pilot program “Test electric for 1 week” with 5-10 pool vehicles. Collect feedback and communicate results.
Insight 5: ownership remains dominant (beware mobility budget)
The numbers
- 86% of Belgians are not interested in car sharing
- 23% are interested in private lease (against 32% in 2024 – decrease)
- 57% want to remain owners (main reason for lack of interest in leasing)
- Generational nuance: 37% of under-35s interested in private lease
For businesses
This data is critical for mobility policies and mobility budgets.
The “car sharing for everyone” model doesn’t work for the majority of Belgian employees. Ownership (or equivalent via company car) remains the dominant model.
Implications for mobility budget:
The car option must remain available
- Don’t impose only alternatives, this allows for progressive transition (mobility budget without pillar 1)
- Leave choice between ownership vs alternatives
- Adjust amount according to choice
Segmentation by Generation
- <35 years: more open to leasing and sharing
- >35 years: stronger attachment to ownership
- Adapt communication by profile
Leasing as a Bridge
- Limited interest (23%) but existing
- Can facilitate transition to electric
- Intermediate solution to test
Mistakes to avoid:
❌ Impose car sharing as only option
❌ Remove car option from mobility budget (pillar 1)
❌ Underestimate attachment to ownership
Recommended action: In your mobility policy, maintain the vehicle option (electric via pillar 1) while valuing alternatives for specific uses.
Insight 6: a generational transition is beginning
The numbers
- Under 35: 37% interested in private lease (vs 23% average)
- Under 35: 24% interested in car sharing (vs 14% average)
- Average age electric borrower: 51 years (vs 52 years in 2024)
For businesses
A progressive transformation of expectations is occurring by generation.
Young employees (born after 1990) grew up in a world where:
- Spotify replaces CD ownership
- Netflix replaces DVD purchase
- Uber exists as alternative to taxi
This generation transposes this model to mobility: usage prevails over ownership.
HR Strategy to Adapt:
Differentiated Policy
- Mobility package “ownership” for traditional profiles
- Mobility package “usage” for young generations
- Flexibility between both
Targeted Communication
- For >40 years: reassure about maintaining car options
- For <35 years: emphasize flexibility and alternatives
- Concrete examples by profile type
Long-term Anticipation
- By 2030, under-35s will be majority
- Prepare progressive model transition
- Test innovative solutions now
Recommended action: Create 2-3 “mobility personas” in your company and adapt your mobility budget offer to each.
Insight 7: costs are falling, TCO becomes competitive
The numbers (BNP financing)
- Average loan amount electric vehicle: €26,678 (-2% vs 2024)
- Average monthly payment: €456 (-3% vs 2024)
- Average duration: 65 months (vs 70 months in 2024)
- 20% of car loans are for vehicles <50g CO₂
For businesses
The decrease in acquisition and financing costs makes electric TCO increasingly attractive.
TCO evolution 2024-2026:
| Element | 2024 | 2026 | Evolution |
|---|---|---|---|
| Average purchase price | €27,200 | €26,678 | -2% |
| Monthly payment | €470 | €456 | -3% |
| Financing duration | 70 mths | 65 mths | -7% |
Factors explaining the decrease:
Broader offering
- More available models
- Entry-level segments
- Increased competition
Second-hand market
- Pressure on new prices
- Credible alternative
- Democratization
Production economies of scale
- Cheaper batteries
- Dedicated electric platforms
- Production volumes
For fleets, the calculation changes:
Electric TCO is generally competitive thanks to three factors:
- Energy cost: Electricity costs 60 to 70% less than
gasoline for the same distance - Reduced maintenance: Fewer wear parts, no oil changes,
savings of 40 to 50% - Tax advantage: In Belgium, progressive deductibility
of electric vehicles vs thermal
The exact tipping point depends on:
- Your annual mileage
- Your usage profile (urban/highway)
- Your charging possibilities (home/office)
- Specific tax benefits
Recommended action: Calculate real TCO on your specific usage profile. Next Mobility can support you in this analysis.
Conclusion: 3 priority actions for 2026
The BNP Paribas Fortis 2026 study confirms that automotive electrification in Belgium is no longer a distant trend but an accelerating reality.
For companies, three priority actions:
1. Plan your replacement schedule (Q1 2026)
- Identify vehicles to renew 2026-2028
- Prioritize uses suitable for electric
- Integrate 10-20% second-hand to test
2. Install charging points to remove anxiety (Q2 2026)
- Start with main sites (headquarters, major sites)
- Provide 1 charging point for 3-4 electric vehicles
- Communicate visibility of deployment plan
3. Mobilize your internal ambassadors (Q1-Q2 2026)
- Identify current electric owners
- Organize testimonials and tests
- Create FAQ based on real experience
Fleet electrification is no longer a question of “if” but of “how and when”. The 2026 data shows conditions are increasingly favorable.
Companies that anticipate will benefit from a competitive advantage: controlled costs, CSRD compliance, HR attractiveness.
💬 Next Mobility supports you
Are you a fleet manager, HR manager, or mobility manager?
Next Mobility can help you:
- Analyze your fleet’s electrification potential
- Calculate your real electric vs thermal TCO
- Plan your transition schedule
- Implement your charging strategy
📚 Sources
- BNP Paribas Fortis (2026). Automotive transition: Belgian households accelerate the shift to electric. Quantitative study by Data Synergy, 1,000 respondents, November 2025.
- Statbel & Federation of Belgian Enterprises. Belgian Mobility Dashboard – Congestion cost 2025.
- Climat.be. Greenhouse gas emissions by sector – 2023 data.
Published January 20, 2026
Author: Nicolas Verstraete, Corporate Mobility Expert
Next Mobility