
Brussels is undergoing a major transformation of its cycling infrastructure. With 1,090 km of cycling facilities in 2024 (including 155 km added since 2019), the Brussels-Capital Region is positioning itself as a territory where soft mobility is becoming an operational reality for businesses. For HR managers, CFOs, and Facility managers, these infrastructures represent much more than bike lanes: they are strategic opportunities to optimize mobility costs, improve employer attractiveness, and contribute to sustainability goals.
1. Brussels cycling infrastructure in numbers: a reality for businesses
Official data from Brussels Mobility reveals remarkable progress in cycling infrastructure, with direct implications for corporate mobility policies.
| Indicator | 2024 Value | Evolution |
|---|---|---|
| Total cycling facilities | 1,090 km | +155 km since 2019 |
| On-road facilities | 604 km | +130 km since 2019 |
| PLUS network (structural) | 36% developed | 59% cyclable (including 23% suboptimal) |
| COMFORT network (inter-district) | 31% developed | 70% cyclable (including 39% functional) |
| Inter-regional connections | 7 completed | 18 in preparation |
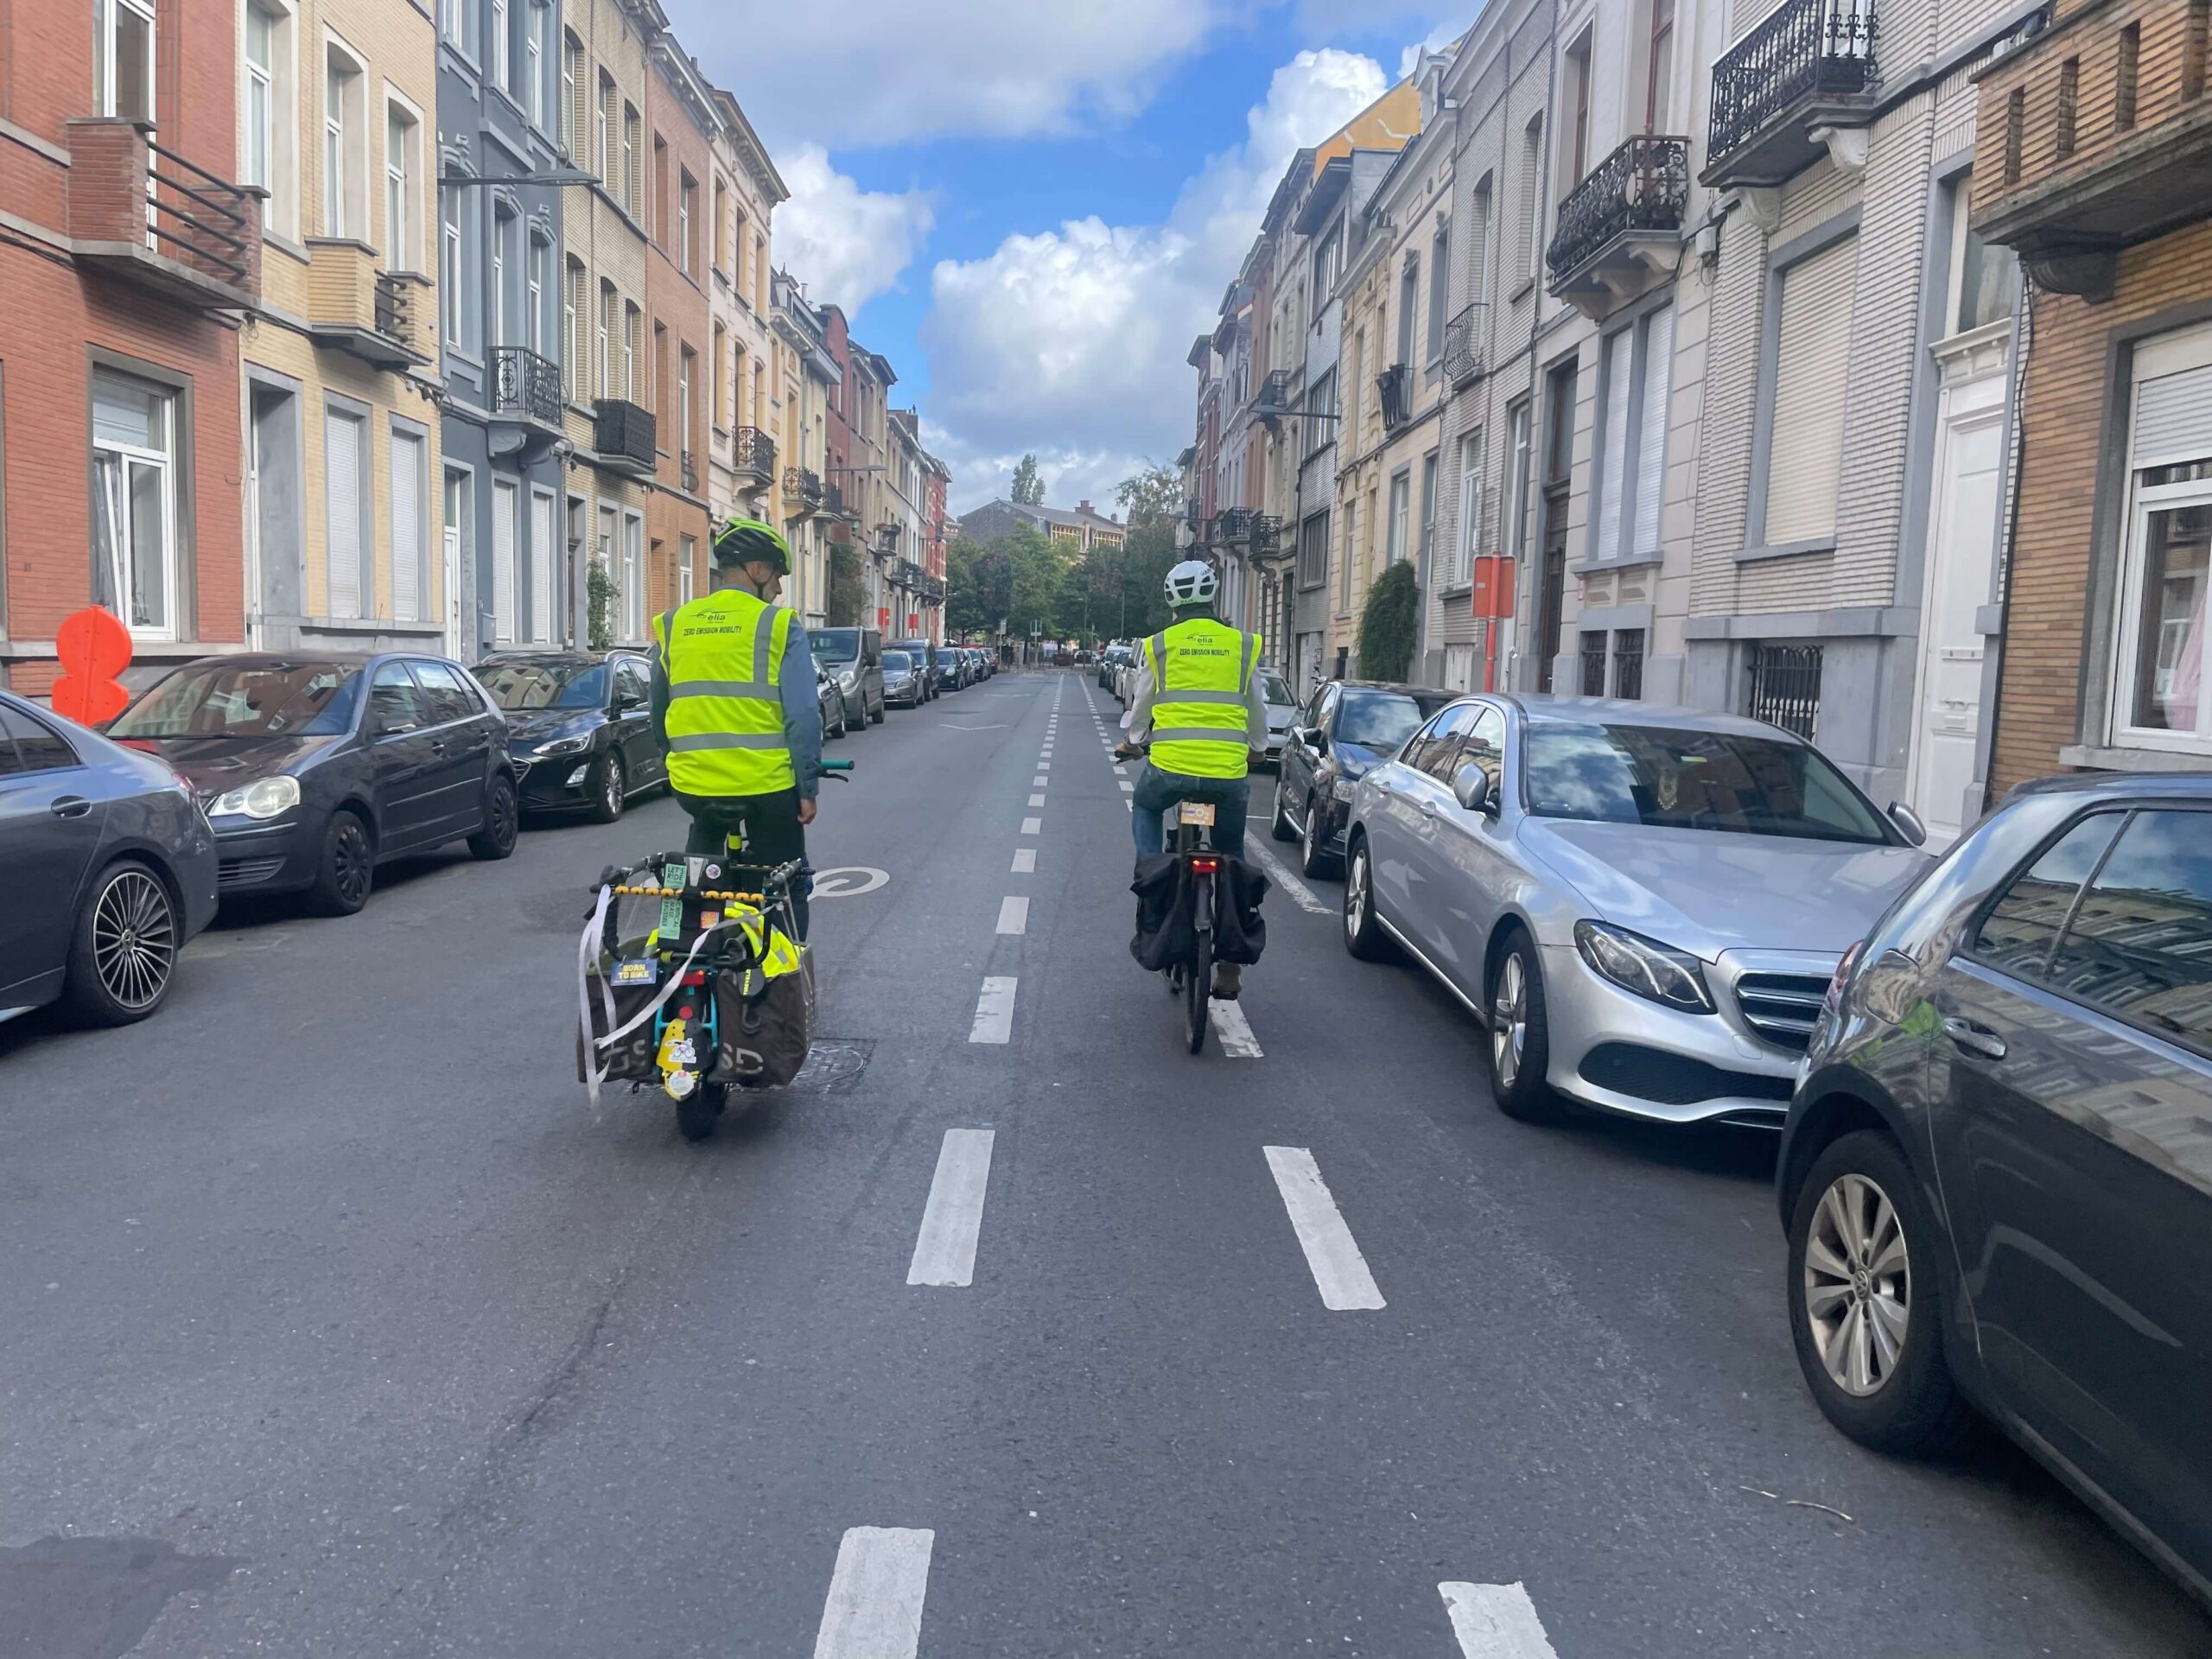
Usage is exploding: 4.9x increase in cyclists between 2010 and 2024
Manual counts conducted between 8am and 9am at 26 measuring points show massive adoption of cycling as a commuting mode. This growth is accompanied by profile diversification:
- 40% of adult cyclists are women (vs 31% in 2010): sign of infrastructure perceived as safer
- 48% of bikes are electric (vs 20% in 2019): extension of practicable distances
- 14% cargo bikes (vs 4% in 2019): potential for corporate cycle logistics
- +6% flows on cycle paths in 2024 compared to 2023
2. What these numbers mean for your mobility policy
2.1. Infrastructure that reduces perceived risk
The increase in female cyclists (40% vs 31% in 2010) is a key indicator of perceived safety. Studies show that women embrace cycling when infrastructure is deemed sufficiently safe and separated from motorized traffic. For businesses, this means:
- Reduction of the main psychological barrier to bike adoption by your employees
- Expansion of the pool of potential candidates for a cycling policy (no longer targeting only “convinced cyclists”)
- Strong argument to convince your management: public infrastructure now supports your sustainable ambitions
2.2. The electric bike: extending the recruitment zone without increasing costs
With 48% electric bikes in circulation (vs 20% in 2019), the cyclable perimeter expands considerably. An e-bike allows comfortable coverage of 10-15 km in less than 45 minutes, making residential areas accessible that were previously dependent on cars or trains.
TCO calculation: company e-bike vs company car
| Cost item | Company e-bike (leasing) | Company car (compact) |
|---|---|---|
| Leasing / Monthly TCO | €50-80/month | €450-650/month |
| Fuel/energy | €2-5/month | €150-250/month |
| Company parking | Negligible | €100-200/month |
| Monthly TOTAL | €52-85/month | €700-1,100/month |
| Annual savings | €7,800 – €12,200 per employee/year | |
For a company of 50 employees replacing 10 company cars with leased e-bikes, annual savings range between €78,000 and €122,000. This amount can finance the development of secure bike parking, showers, and still generate substantial net profit.
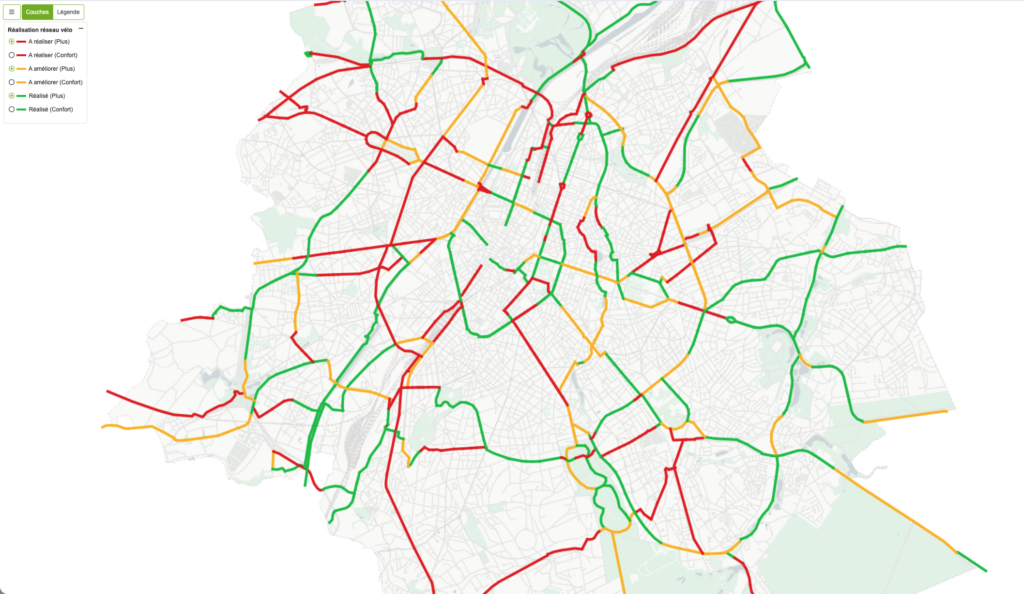
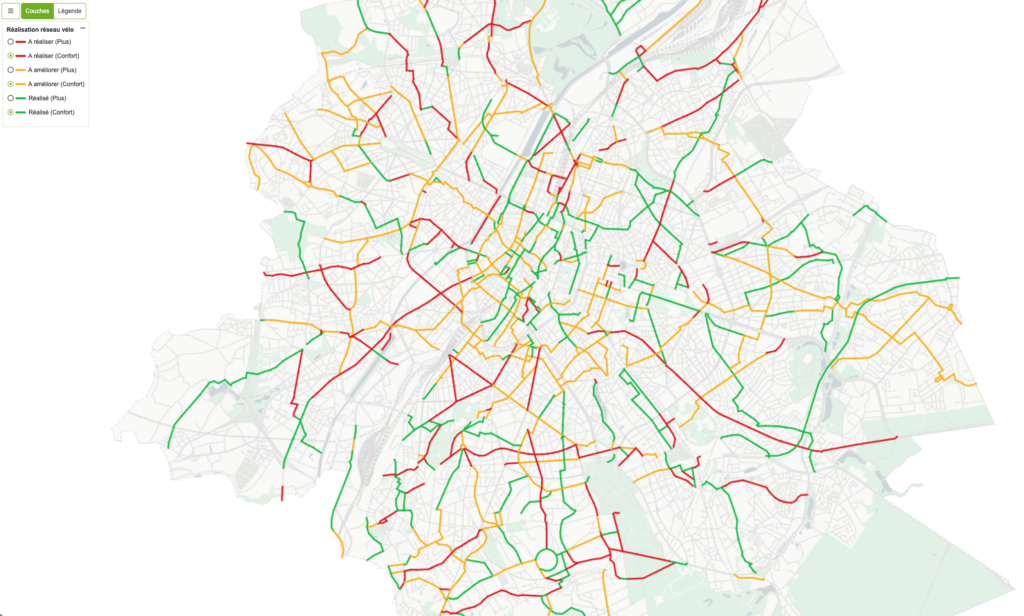
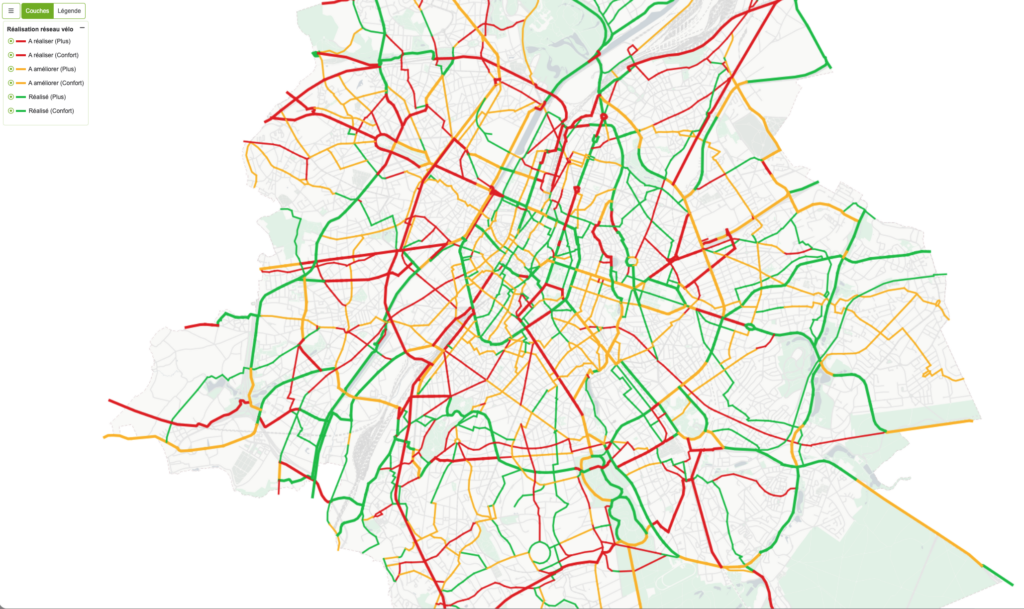
2.3. Locate your company on the structural network
Brussels Mobility distinguishes between two levels of structural cycling network:
- PLUS network: fast connections at metropolitan scale (36% developed, 59% cyclable)
- COMFORT network: inter-district movements (31% developed, 70% cyclable)
Checklist: assess your site’s cycling accessibility
- ☐ Is your headquarters located within 500m of a PLUS or COMFORT network route?
- ☐ Do you benefit from one of the 7 completed inter-regional connections (Flanders/Wallonia)?
- ☐ Can your employees access the cycling network in less than 10 minutes on foot from the nearest station?
- ☐ Do you benefit from the Canal route (67% compliant with Vademecum) or the Middle Ring (33% compliant)?
Interactive map available: https://data.mobility.brussels/mobigis
3. Concrete opportunities for businesses
3.1. Cargo bikes: new standard for urban logistics
With 14% cargo bikes in circulation (vs 4% in 2019), Brussels sees a viable urban logistics solution emerging. Companies can now:
- Replace light commercial vehicles for intra-urban deliveries (last mile)
- Optimize professional travel of technicians and sales representatives in dense urban areas
- Access low-emission zones without restrictions or penalties
Use case: replacing a van with an electric cargo bike
| Diesel van | Electric cargo bike | |
|---|---|---|
| Monthly TCO | €800-1,200/month | €150-250/month |
| Parking | €150-300/month | Negligible |
| LEZ constraints | Increasing | Unrestricted access |
| Range | 100+ km | 40-60 km (sufficient for 70% of urban trips) |
| Annual savings | €7,800-€12,600/year | |
3.2. Benefit from regional subsidies and incentives
The Brussels-Capital Region financially supports companies investing in cycling mobility. Main schemes include:
- mobility.brussels subsidy: up to 50% of secure bike parking installation costs
- Electric bike premium: up to €500 for e-bike purchase (income conditions)
- Bike leasing tax advantage: full tax deductibility for employers
- Bike allowance: €0.27/km exempt from taxes and social contributions (mobility budget)
3.3. Align mobility and ESG objectives
Brussels cycling infrastructure now enables companies to translate ESG commitments into concrete and measurable actions:
- Quantifiable CO₂ emissions reduction: 1 km bike = -143g CO₂ vs car
- Simplified CSRD reporting: commuting data easily documented
- Wellbeing improvement: reduced absenteeism (15-20% according to Dutch studies)
- Employer attractiveness: 60% of Brussels residents want to use bikes more with better infrastructure
4. Roadmap: from intention to action
To capitalize on Brussels cycling infrastructure, Next Mobility recommends a structured 4-step approach:
Phase 1: Cycling accessibility diagnosis (2-3 weeks)
- Mapping of employee commuting routes
- Proximity analysis relative to PLUS and COMFORT networks
- Identification of necessary complementary infrastructure (secure parking, showers, lockers)
- Benchmark with similar sites in your sector
Phase 2: Financial modeling (1-2 weeks)
- Comparative TCO calculation (car vs e-bike vs cargo bike)
- Simulation of different adoption scenarios (10%, 25%, 40% cyclists)
- Identification of mobilizable subsidies and incentives
- Business case including ESG and HR benefits (absenteeism, attractiveness)
Phase 3: Cycling mobility plan design (3-4 weeks)
- Definition of bike leasing policy (electric, cargo, conventional)
- Implementation of bike mileage allowance (payroll integration)
- Technical specifications for secure parking and equipment
- Internal communication plan and awareness campaign
- Definition of tracking KPIs (adoption rate, savings achieved, CO₂ avoided)
Phase 4: Implementation and support (3-6 months)
- Selection and contracting of leasing partners
- Infrastructure installation (parking, showers, e-bike charging points)
- Road safety training and e-bike familiarization
- Progressive deployment with pilot group then generalization
- Monthly reporting and adjustments
Conclusion: the infrastructure is there, so is the opportunity
With 1,090 km of cycling facilities, a 4.9x increase in cyclists in 14 years, and 48% electric bikes in circulation, Brussels reaches a critical threshold. Public infrastructure now supports ambitious corporate mobility policies without requiring disproportionate employer investments.
Companies acting now benefit from a triple advantage:
- Economic: 85-90% reduction in mobility TCO compared to company cars
- Strategic: HR differentiation and measurable ESG alignment
- Operational: mature public infrastructure reducing adoption risks
Sources: Brussels Mobility – Thematic Observatory Bike (2024 data) • data.mobility.brussels – Cycling facilities • Good Move – Regional Mobility Plan 2020-2030 • Vademecum Bike 1-11 – Brussels Mobility